
Designing the Bukas Partner Dashboard
for school admins and growth teams.
A centralized web dashboard for managing leads, activations, disbursement tracking, risk cohorts, and partner administration. The redesign focused on conversion visibility and lower operational friction.
Role
Product Design Lead & IC
Timeline
2021 · Multi-sprint rollout
Platform
Web Dashboard
Industry
Education Financing
Leads Encoded
69
Tracked in the leads module
Bukas Accounts
32
Registered from encoded leads
Installment Apps
12
Reached application stage
Disbursed Amount
₱89,090
From lead-driven activations
01 Context
Why the dashboard mattered, and why the old one wasn't working.
The Challenge
Partner teams at Bukas were handling lead intake, notifications, school coordination, and risk follow-up across disconnected tools. The most painful gap was conversion visibility between encoded leads and activated applications. Teams could execute operations, but they could not quickly understand where momentum was being lost.
The Mandate
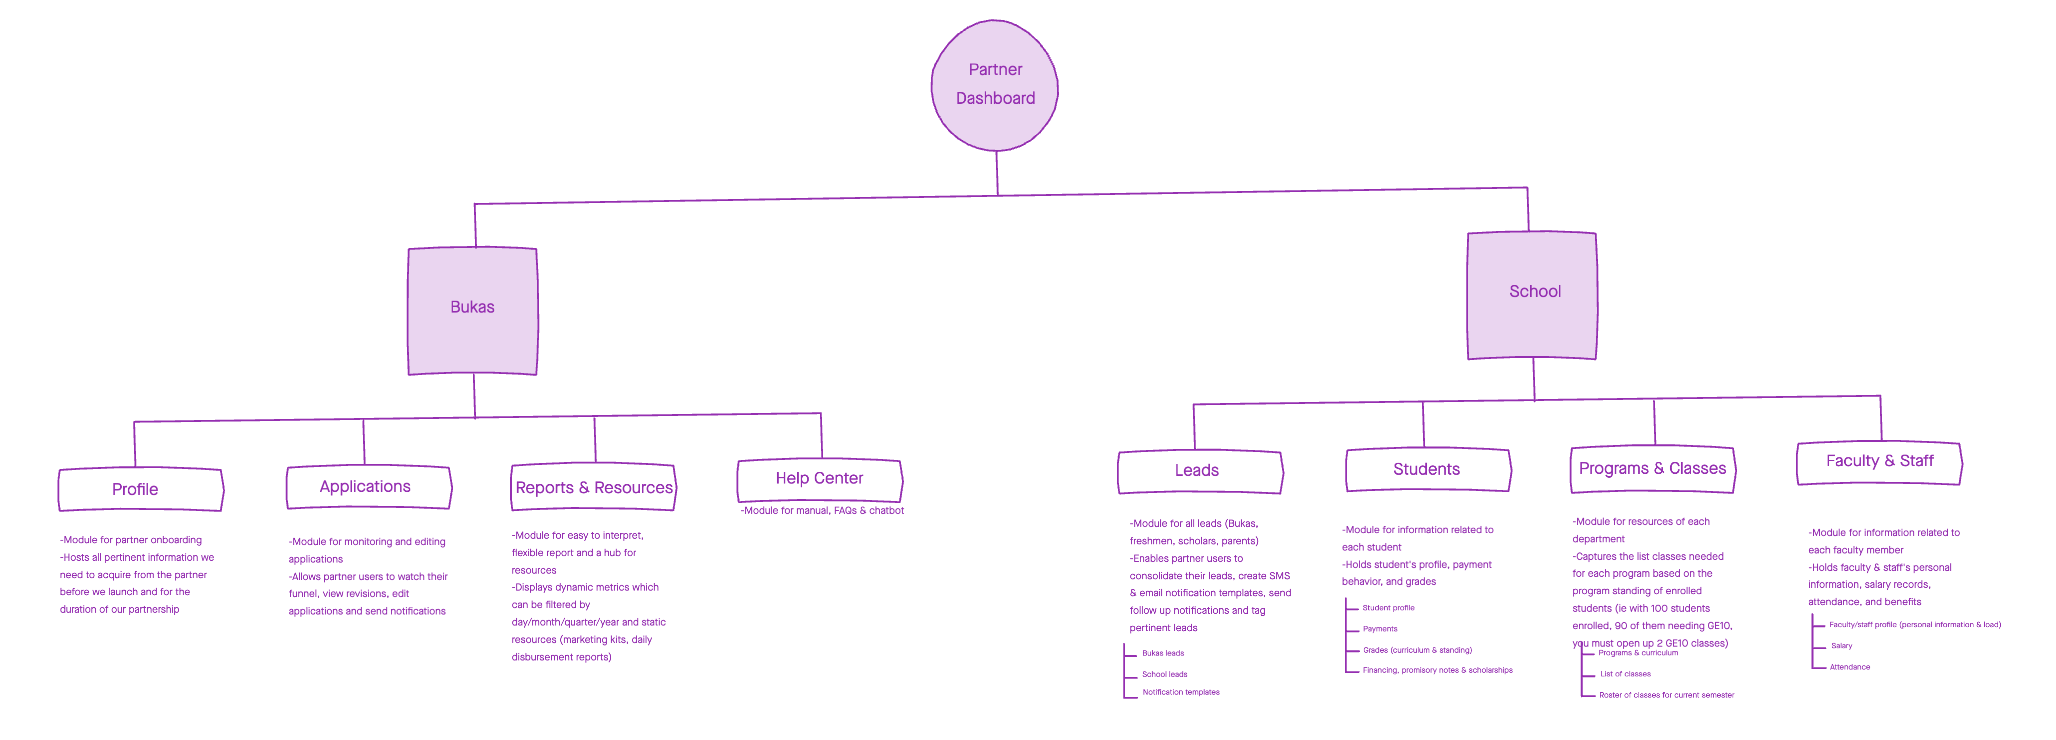
Build a single partner dashboard that connects leads, activations, disbursement reports, risk monitoring, and admin management. The product needed to support school-side operators and internal partnership teams with clear states, batch-friendly actions, and reliable feedback after every ingest or status change.
Conversion snapshot
Before revamp vs after
Workshop synthesis showed repeated drop-off between encoded leads, account registration, and activation. The redesigned flow made each stage explicit so teams could act faster on the right bottleneck.
02 Process
Four stages. Each one built on what the last one found.
Workflow Mapping
Stage 01I mapped operational flows from lead batch upload to SMS notification, OTP setup, registration, and activation. This exposed where state changes were invisible and where teams had to reconcile progress manually.
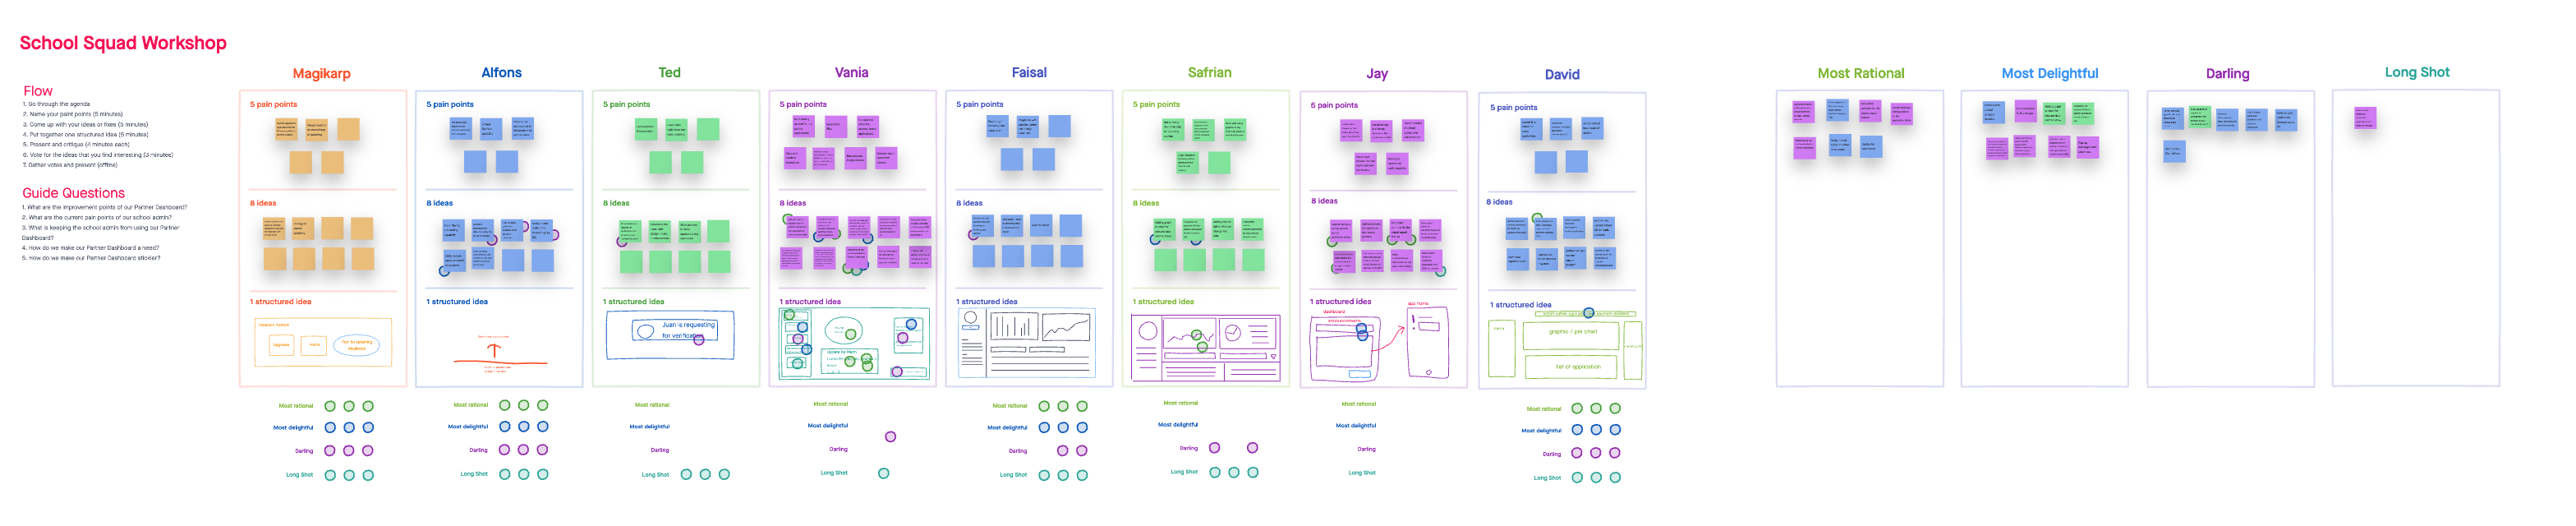
School Squad Workshop
Stage 02Eight contributors each captured five pain points and eight opportunity ideas, then structured one concept each. We used rational vs delightful vs daring voting to prioritize a dashboard architecture the whole squad could support.
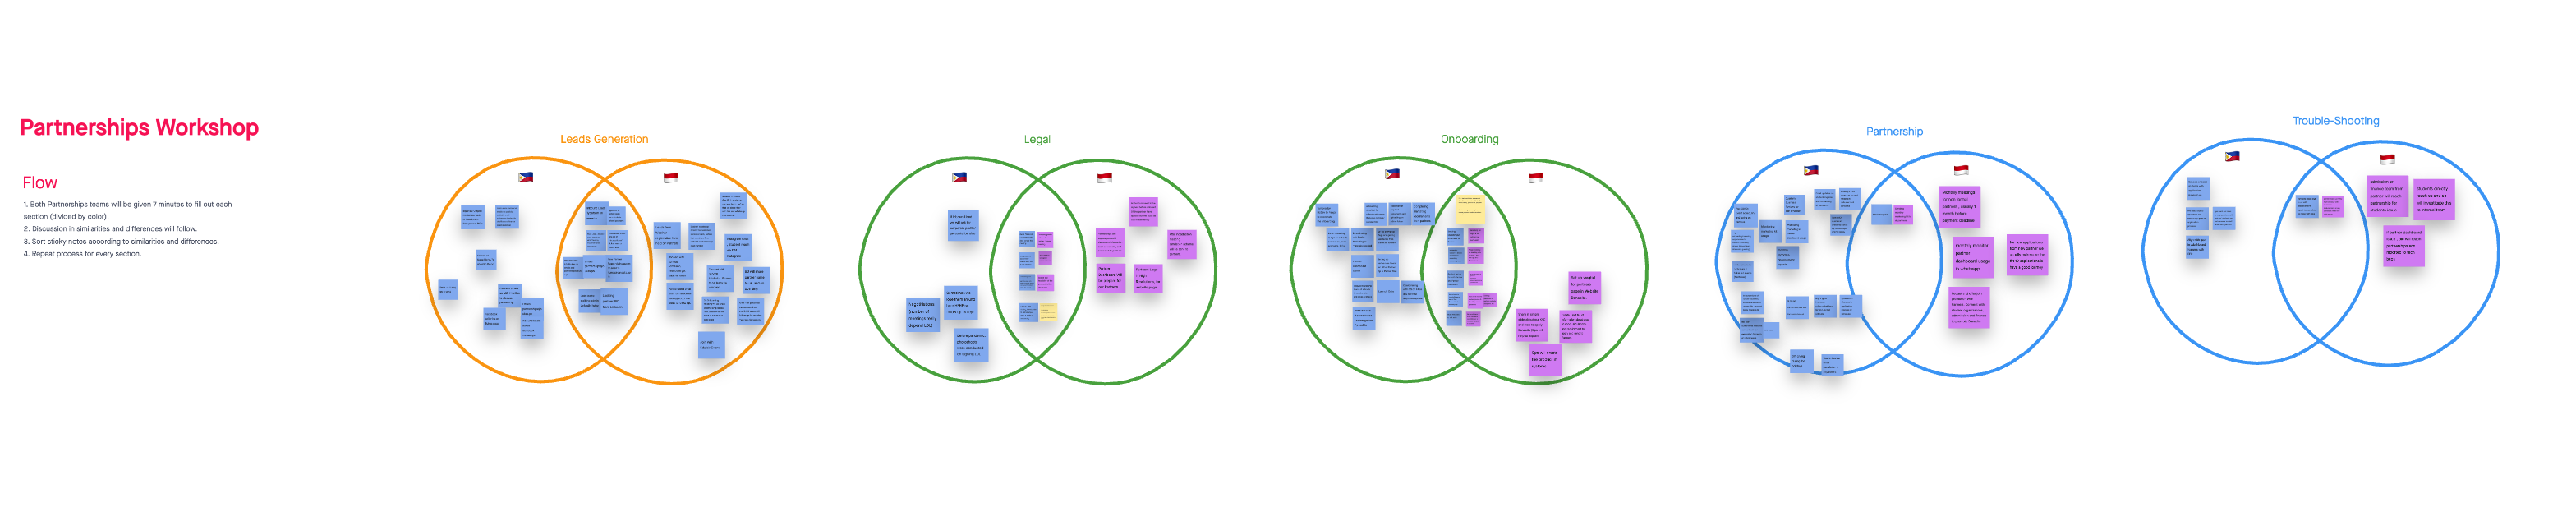
Partnership Workshop
Stage 03We aligned Philippines and Indonesia partnership teams on recurring friction across lead generation, legal coordination, onboarding, and troubleshooting. This gave us shared module boundaries and clearer ownership by workflow.
Prototype, Validate, Ship
Stage 04We translated the winning concepts into clickable flows for Dashboard, Leads, Risk Module, Admin, and Profile Settings. Validation focused on batch operations, conversion traceability, and clear success/error states.
03 The Existing Product
Audit of v0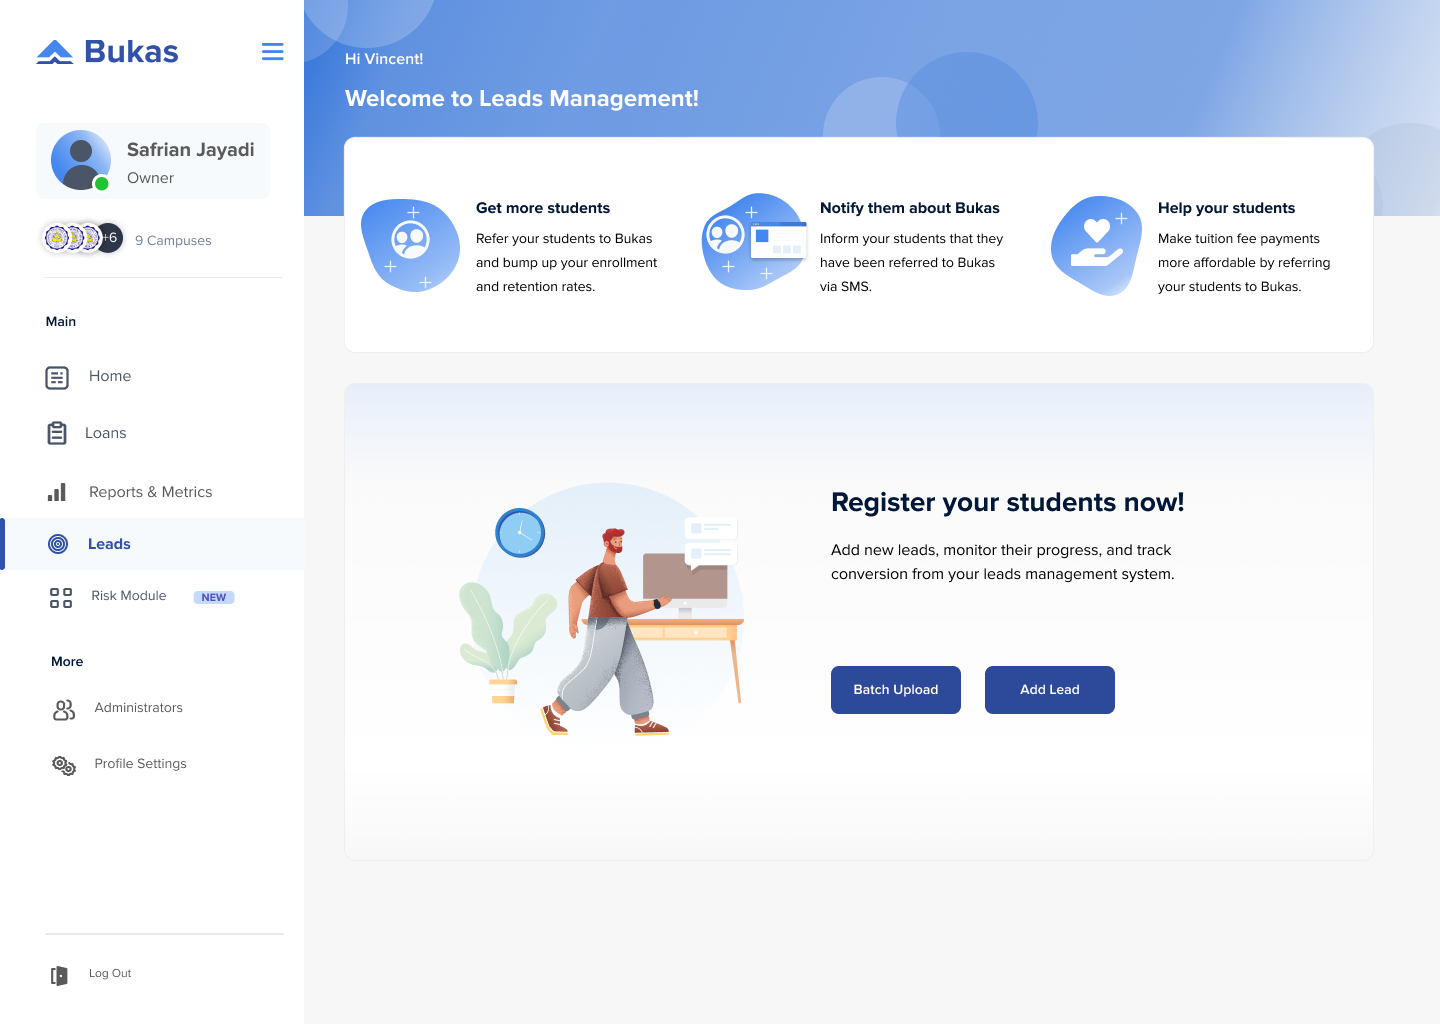
Five recurring friction points found across workflow mapping and workshops.
Issue 01
Fragmented workflows
Leads, reports, and school operations lived in separate surfaces, forcing context switching for basic daily tasks.
Issue 02
Unclear batch-ingest feedback
After upload and ingest, teams lacked explicit confirmation on what succeeded, failed, or still needed follow-up.
Issue 03
Weak conversion traceability
Teams could not quickly track movement from lead encoded → registered → application → activated.
Issue 04
Risk monitoring was disconnected
Cohort NPL and repayment status checks were scattered, slowing prioritization and intervention.
Issue 05
Admin management was too manual
Adding admins, campus access, and permissions took too many steps and created avoidable operational overhead.
04 Workshops & Research
School Squad + Partnerships synthesisWe ran two structured workshop tracks. The School Squad session converged on day-to-day operator pain points and dashboard interaction patterns, while the Partnerships session aligned PH and ID teams on lead generation, legal, onboarding, and troubleshooting workflows.
Methodology
- → Flow mapping from lead upload to activation
- → School Squad ideation workshop (pain points, ideas, voting)
- → Partnerships workshop across PH and ID teams
- → Concept prioritization into module architecture
Participant snapshot
8
Squad members
2
Market teams
5
Pain points each
School Squad Workshop
Partnerships Workshop
Synthesis board · affinity mapping
Key Design Findings
Typography
Bigger text, always.
Conversion stages are only useful if operators can parse them at a glance. Strong hierarchy reduced scanning time on busy tables.
Contrast
Feedback must be explicit.
For batch uploads and ingest actions, teams needed unmissable success/error states and retained context to avoid duplicate work.
Copy
Modular IA wins.
Separating Dashboard, Leads, Risk, Admins, and Profile Settings reduced ambiguity and made ownership by team much clearer.
05 Design Principles
Layout & structure rules01
Clarity First
Show lead-to-activation states clearly so teams can spot drop-off and act without digging.
02
Batch-First Actions
Frequent ops tasks (upload, ingest, follow-up) must be fast, repeatable, and safe for large lists.
03
Module Boundaries
Organize by operational jobs: Dashboard, Leads, Risk Module, Admins, and Profile Settings.
04
Risk Readability
Cohort health and repayment status must be legible enough to prioritize interventions quickly.
06 Wireframes
Lo-fi structural exploration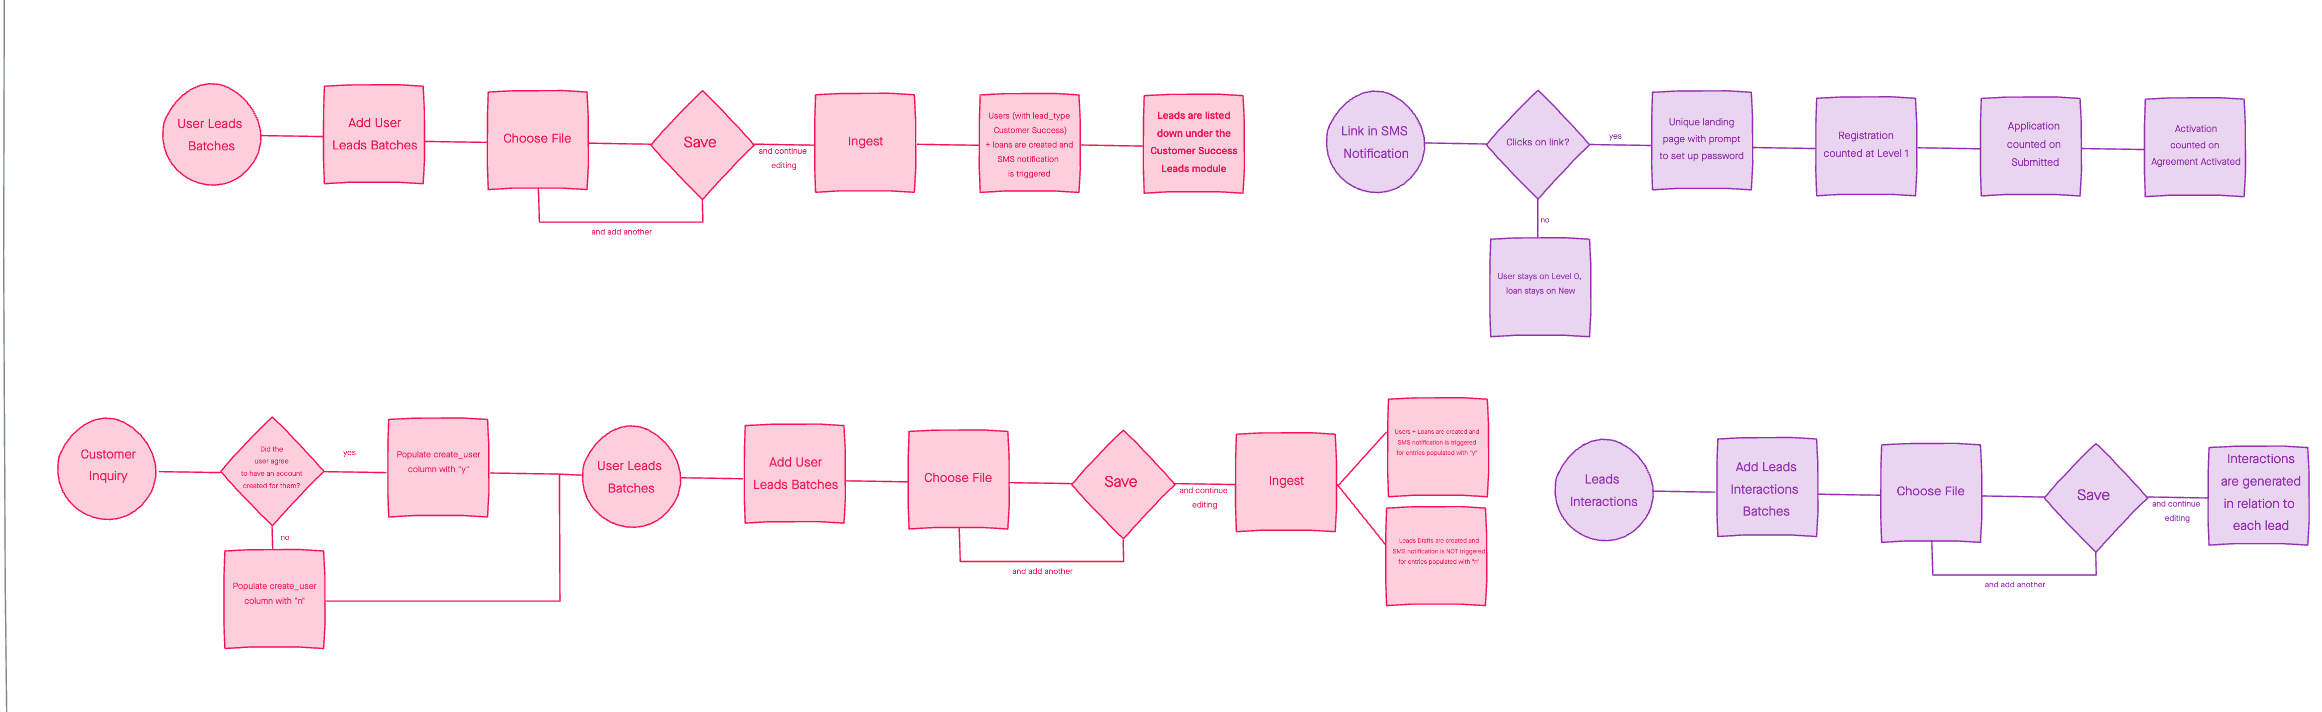
What changed
- Dashboard Home: surfaced weekly activations, new applications, and disbursement updates in one view.
- Leads Module: combined search, date filters, conversion metrics, and lead tables in a single operational workspace.
- Risk Module: added cohort-level NPL context and repayment status table for clearer monitoring.
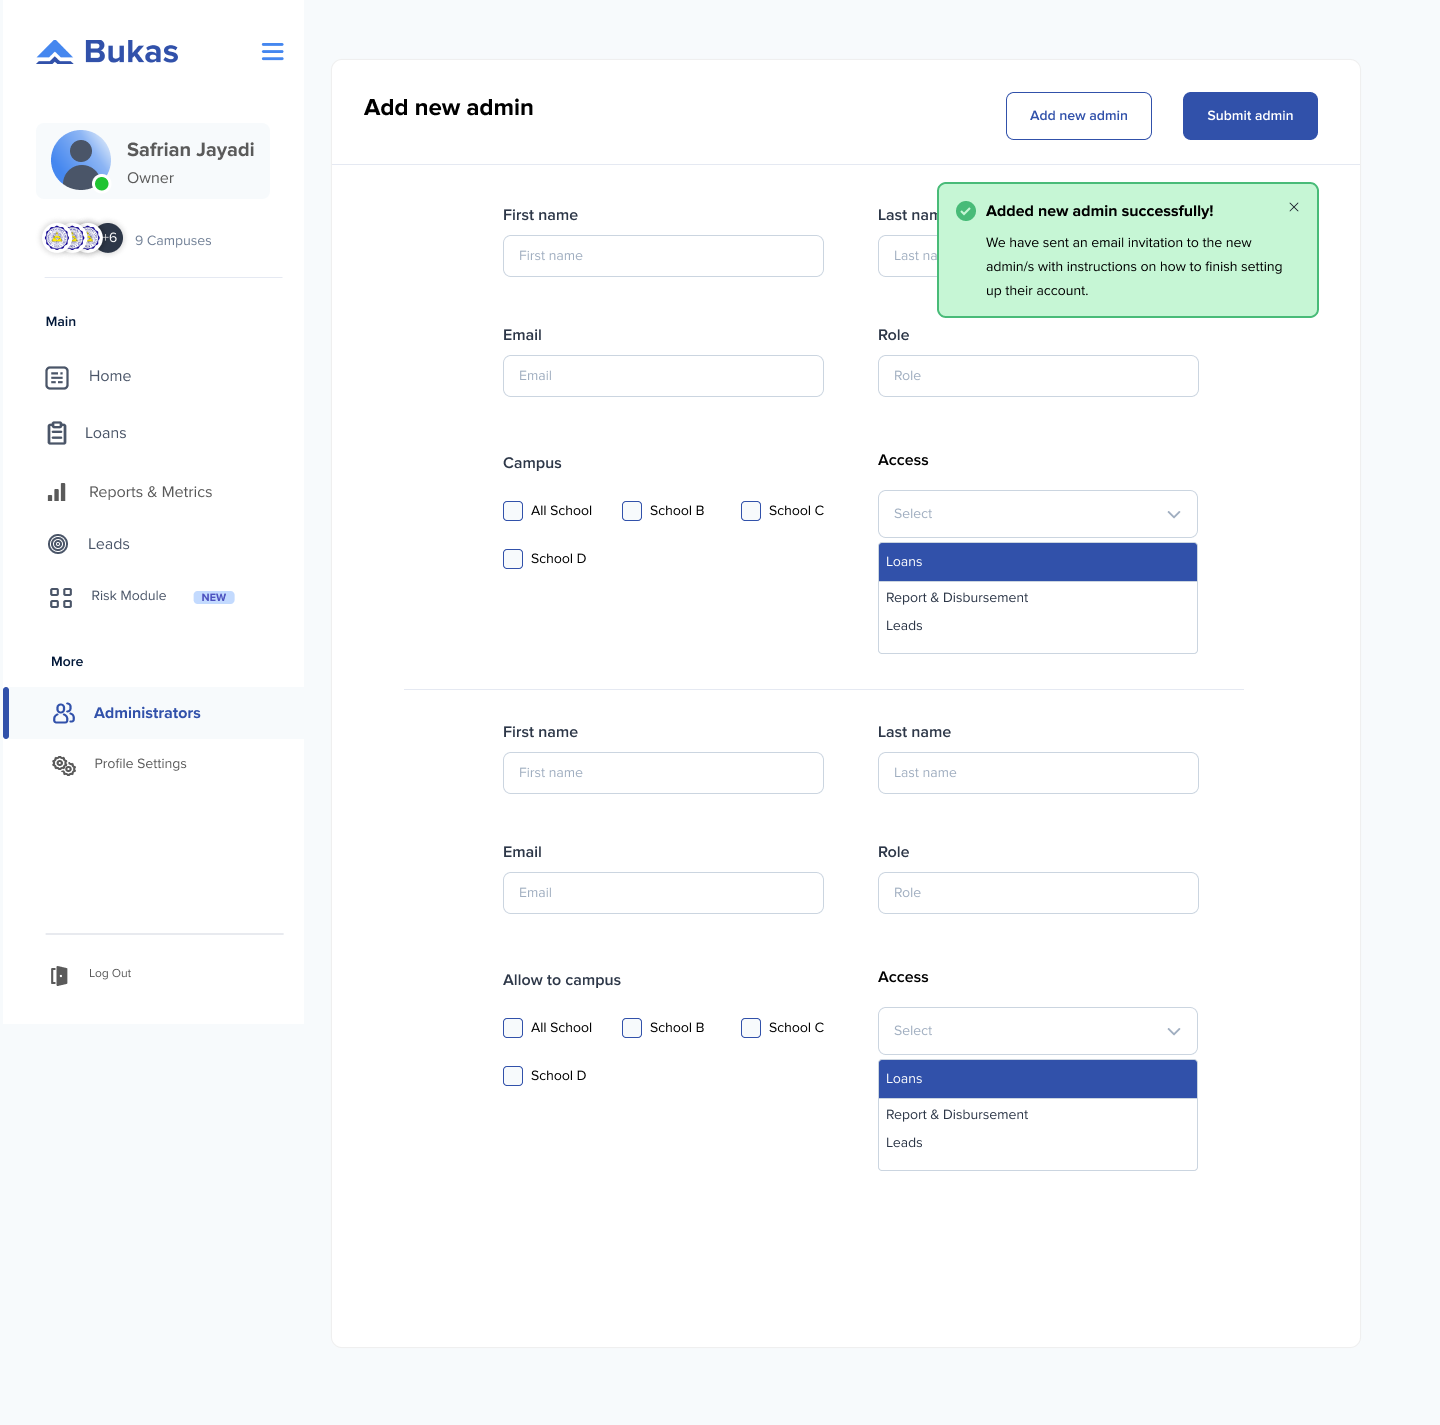
- Admin & Access: streamlined admin creation, campus assignment, and permissions into one flow.
07 High Fidelity
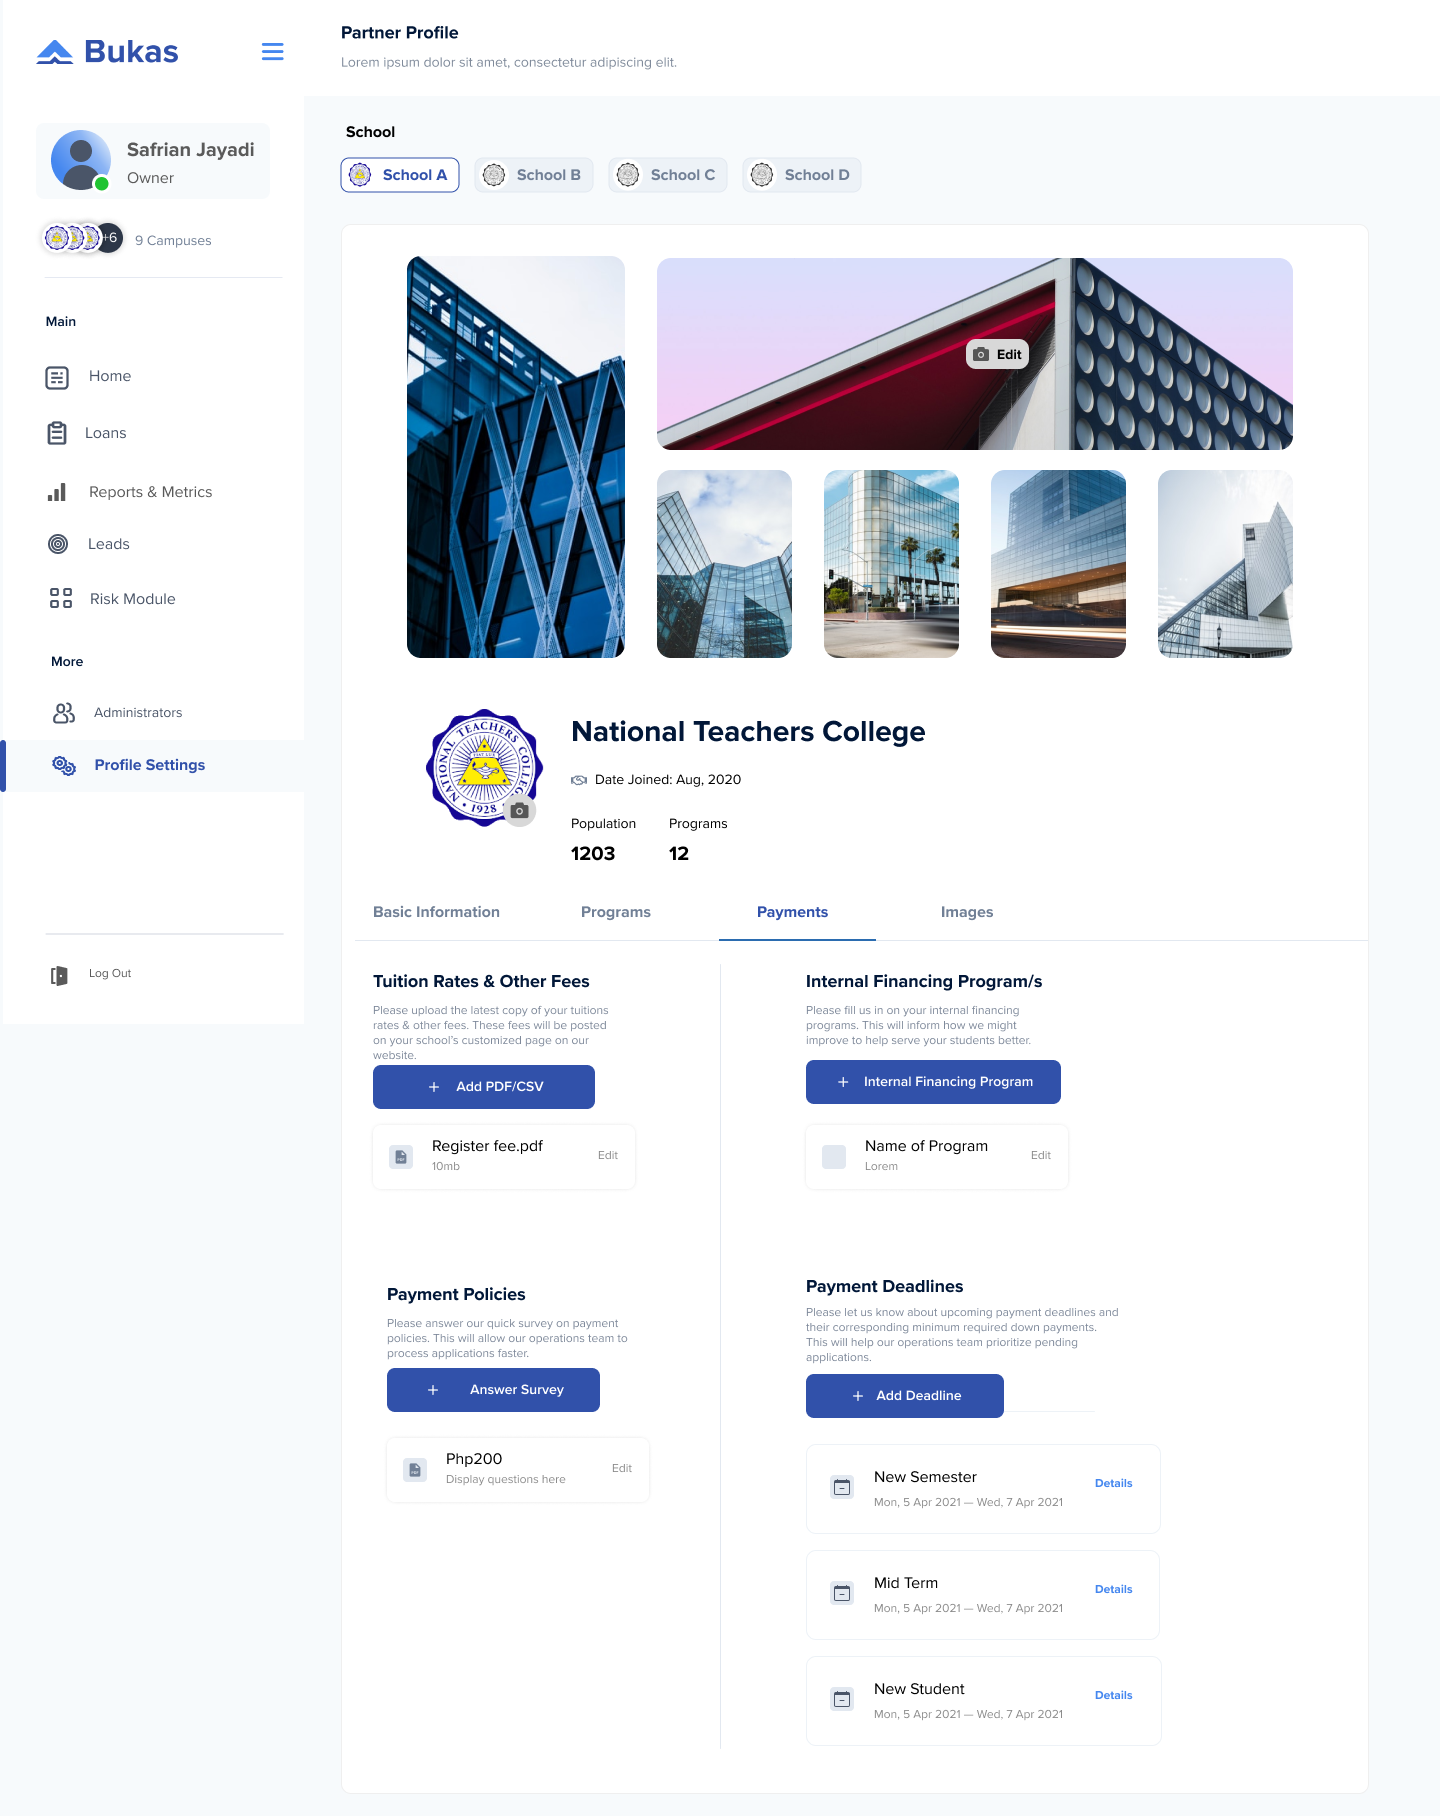
Shipped interfaceDesign Narrative
Information hierarchy: weekly activations, new applications, and disbursement updates are surfaced first so teams can triage quickly before diving into module-level detail.
Action density: high-frequency actions like Add Lead, Batch Upload, and filtered lead review are grouped in the same operational zone to reduce tab-hopping.
Status transparency: conversion states are visible from encoded leads to activation, making drop-off and intervention points obvious for both ops and partnership teams.
Risk readability: cohort-level risk summaries and repayment status tables support fast prioritization without requiring manual spreadsheet reconciliation.
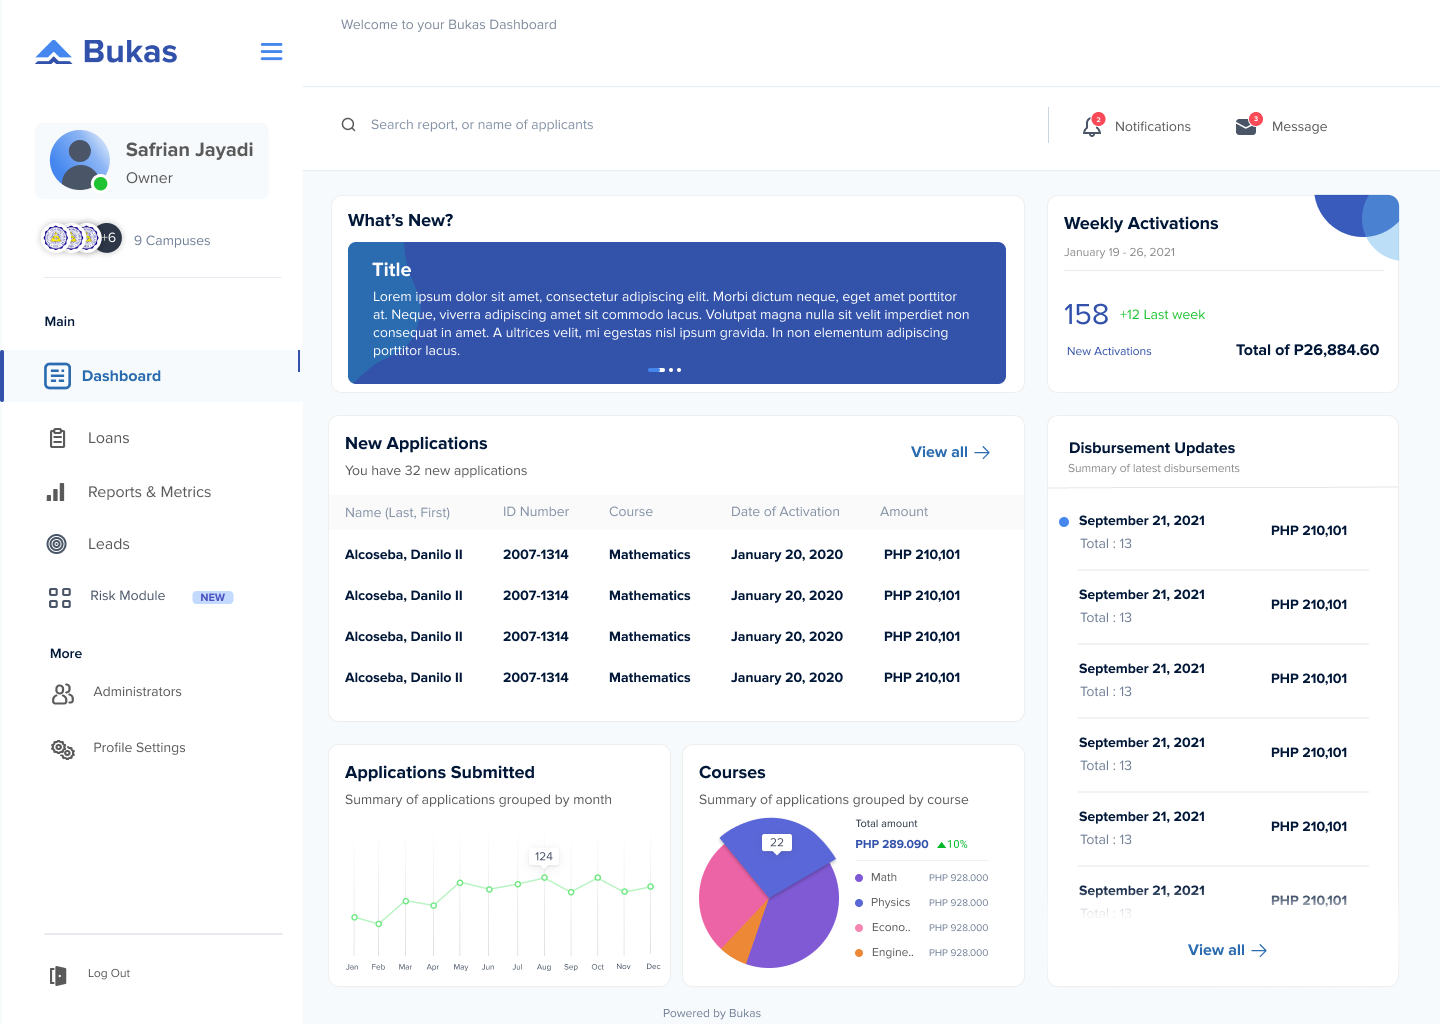
Dashboard Home
A consolidated home view with weekly activations, new applications, disbursement updates, and high-signal summaries for daily operations.
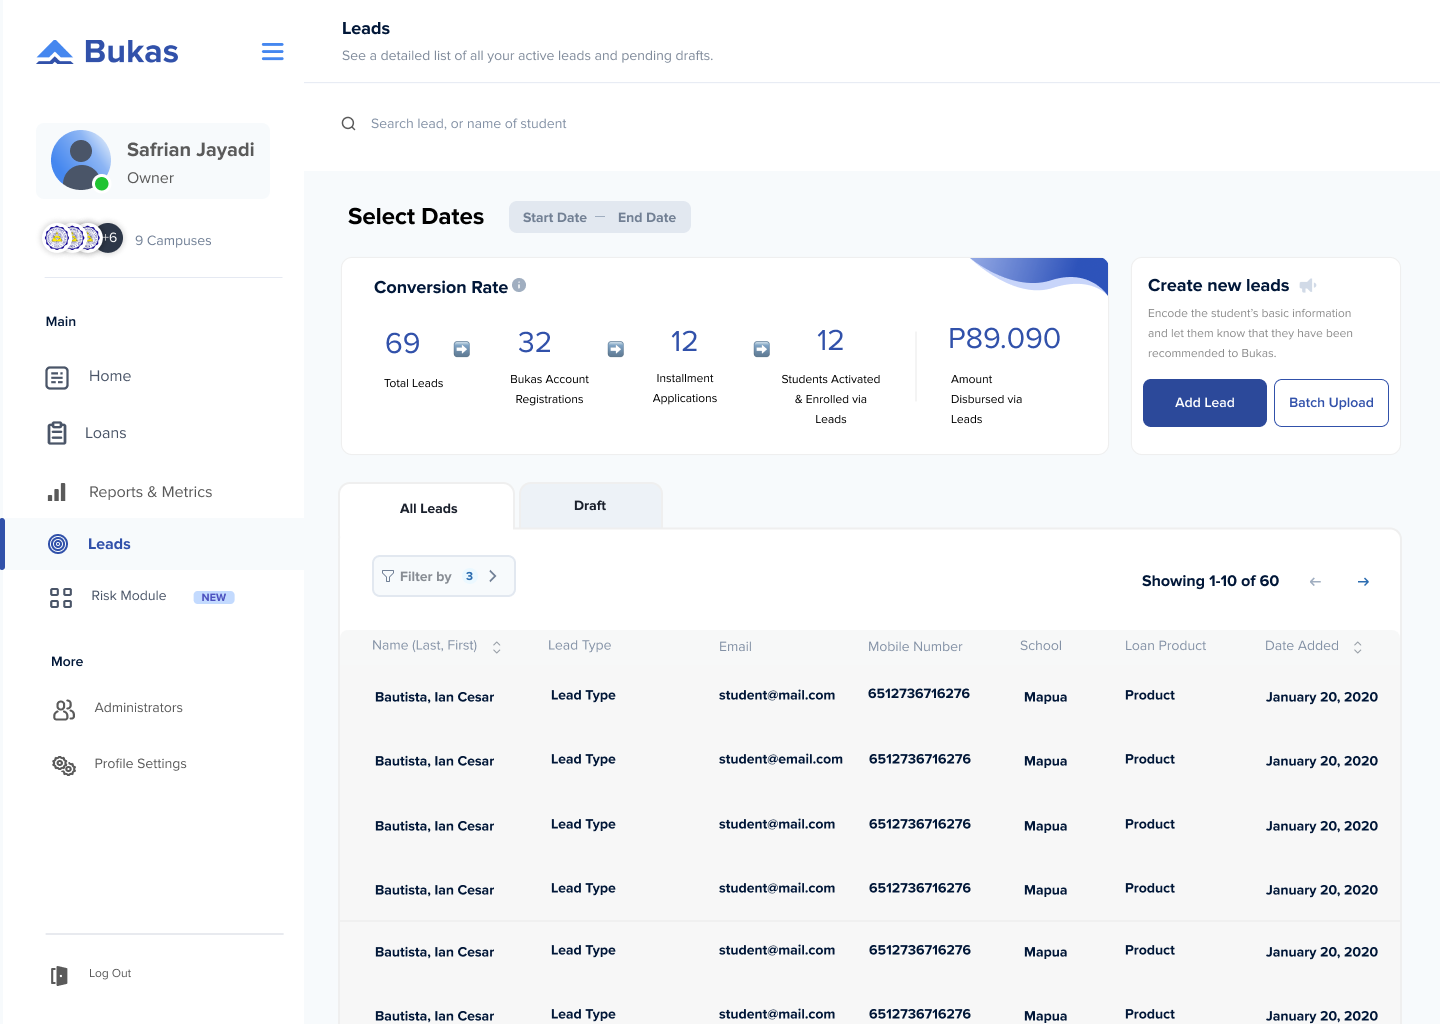
Leads Operations
Date filters, conversion counters, Add Lead / Batch Upload actions, and explicit ingest feedback to support high-volume lead workflows.
Design Challenges We Set Out to Solve
- → Unify leads and activation states in one operational view
- → Make batch upload outcomes explicit and easy to validate
- → Surface risk monitoring without manual reconciliation
- → Simplify admin and campus access management
What We Shipped
- ✓ Conversion pipeline visible from lead to activation
- ✓ Batch actions with clear success and follow-up cues
- ✓ Risk module highlighting cohort health at a glance
- ✓ Centralized admin and permission flows
The
Impact.
"The redesigned leads flow made conversion visible end-to-end: 69 leads encoded, 32 account registrations, 12 installment applications, and ₱89,090 disbursed from lead-driven activations."
Centralizing Dashboard, Leads, Risk, Admin, and Profile workflows reduced context switching for partnership teams and made operational decisions faster and more consistent.
Takeaways.
// 01
Map the real operation, not the ideal flow.
The breakthrough came from mapping uploads, ingest, SMS, OTP, and activation as one system, not separate screens.
// 02
Workshops create alignment faster than assumptions.
School Squad and Partnerships sessions exposed shared pain points early and gave us clear priorities to ship.
// 03
Feedback states are product features.
In high-volume batch workflows, explicit success/error states and state retention prevent costly rework.